In the first full post-Carillion assessment of the finances of the UK's 100 largest contractors, conservative trading is the name of the game as clients seeks more financially secure partners. Finance editor David Price explores why big is no longer beautiful in the construction industry
This page was published in 2019. For a more up-to-date analysis of the UK's largest construction contractors, check out the CN100 list for 2021.
For four consecutive years, the CN100 has revealed a gradual deterioration in the performance of construction's largest firms.
The average pre-tax margin for the top 10 fell year on year, dropping as low as -0.9 per cent in last year's edition.
In 2018, the industry also lost one of its biggest players in Carillion and there were warning signs at other industry behemoths.
However, this year's CN100 paints a brighter picture. The UK's largest businesses have turned a corner.
This year's top 10 have seen the first increase in average margin for five years, thanks to larger profit for those in the black and smaller losses for those in the red.
"Contractors have been trying hard to improve margins. It's taken [Balfour] about three or four years to get all of the problem projects out of their portfolio"
Simon Rawlinson, Arcadis
After a painful few years of provisions, cost-cutting and turnaround programmes, the UK's biggest contractors appear to have changed their course. For many, this has meant a more conservative approach to trading.
Turnover growth has flattened out as many turned away from expanding the top line to focus on the bottom line.
Carillion's demise, Interserve's near-death experience and Kier's travails have smashed the myth that with greater size comes greater safety.
Clients and suppliers are now paying much closer attention to underlying financial health and placing greater value in liquidity, working capital levels and leverage.
Strength, not size, is now the desired quality. And if worrying signs about where the market is heading are accurate, this change in attitude might have come not a moment too soon.
Profit soars
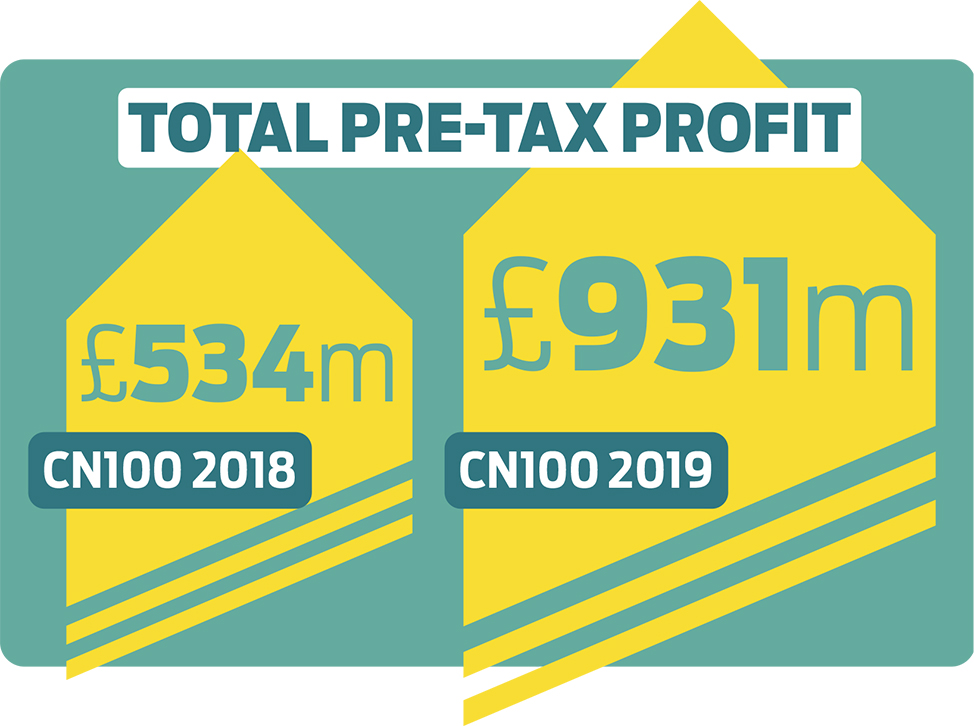
The total net pre-tax profit for the top 100 stands at £931m, a remarkable 74 per cent increase from the £534m recorded last year.
The biggest change was among the largest firms with revenue above £1bn, a group that is exclusively made up of tier one contractors. Twelve out of the fourteen in this rarefied set saw an improvement in the last year, whether that was profits rising, or for Interserve and Laing O'Rourke, losses shortening.
The median margin for this group has more than doubled from 0.8 per cent to 2.1 per cent, and this improvement is the product of several years' hard work to deal with contracts picked up in more difficult times.
Arcadis head of strategic insight and research Simon Rawlinson says: "I think that contractors over a number of years have been trying really hard to improve their margins.
CN100: TURNOVER
| CN100 2019 rank | CN100 2018 rank | Change | Company | Revenue (£m) – latest | Revenue (£m) – previous | Accounting year ending |
|---|---|---|---|---|---|---|
| 1 | 1 | 0 | Balfour Beatty | 6634.0 | 6916.0 | 31/12/2018 |
| 2 | 2 | 0 | Kier | 4239.6 | 4128.8 | 30/06/2018 |
| 3 | 5 | 2 | Morgan Sindall | 2971.5 | 2792.7 | 31/12/2018 |
| 4 | 6 | 2 | Galliford Try | 2931.6 | 2662.1 | 30/06/2018 |
| 5 | 3 | -2 | Interserve | 2904.0 | 3250.8 | 31/12/2018 |
| 6 | 4 | -2 | Laing ORourke | 2758.1 | 2934.6 | 31/03/2018 |
| 7 | 8 | 1 | Mace | 2350.0 | 1971.8 | 31/12/2018 |
| 8 | 7 | -1 | Amey | 2323.1 | 2198.2 | 31/12/2018 |
| 9 | 10 | 1 | ISG | 2237.6 | 1708.8 | 31/12/2018 |
| 10 | 9 | -1 | Skanska UK | 1935.4 | 1802.7 | 31/12/2018 |
| 11 | 12 | 1 | Wates | 1500.6 | 1530.2 | 31/12/2018 |
| 12 | 11 | -1 | Costain | 1463.7 | 1684.0 | 31/12/2018 |
| 13 | 14 | 1 | Willmott Dixon | 1323.2 | 1269.5 | 31/12/2018 |
| 14 | 15 | 1 | Multiplex | 1064.9 | 1155.4 | 31/12/2018 |
| 15 | 20 | 5 | VolkerWessels UK | 984.1 | 870.4 | 31/12/2018 |
| 16 | 16 | 0 | Bam Construct | 949.8 | 953.0 | 31/12/2018 |
| 17 | 13 | -4 | Bouygues UK | 937.6 | 878.9 | Various |
| 18 | 18 | 0 | Bowmer and Kirkland | 937.6 | 928.3 | 31/08/2018 |
| 19 | 19 | 0 | Vinci | 873.3 | 870.7 | 31/12/2018 |
| 20 | 17 | -3 | Sir Robert McAlpine | 870.5 | 942.5 | 31/10/2018 |
| 21 | 23 | 2 | Murphy Group | 781.3 | 748.6 | 31/12/2018 |
| 22 | 26 | 4 | Morrison Utility Services | 778.4 | 655.5 | 31/03/2018 |
| 23 | 25 | 2 | Engie Regeneration | 758.8 | 665.8 | 31/12/2018 |
| 24 | 24 | 0 | Bam Nuttall | 749.9 | 668.8 | 31/12/2018 |
| 25 | 21 | -4 | Graham | 735.0 | 767.6 | 31/03/2019 |
| 26 | 22 | -4 | Robertson | 713.4 | 752.4 | 31/03/2019 |
| 27 | 28 | 1 | McLaren | 585.6 | 600.3 | 31/07/2018 |
| 28 | 27 | -1 | Lendlease* | 570.2 | 375.5 | Various |
| 29 | 32 | 3 | NG Bailey | 555.7 | 481.0 | 01/03/2019 |
| 30 | 29 | -1 | Renew | 540.6 | 543.7 | 30/09/2018 |
| 31 | NEW | - | Colas | 539.9 | 472.2 | Various |
| 32 | 30 | -2 | Carey Group | 510.5 | 549.2 | 31/03/2018 |
| 33 | 34 | 1 | Buckingham Group | 507.0 | 423.1 | 31/12/2018 |
| 34 | 36 | 2 | Hill Holdings | 501.5 | 415.6 | 31/12/2018 |
| 35 | 31 | -4 | Eurovia Group | 501.4 | 486.2 | 31/12/2018 |
| 36 | 33 | -3 | Winvic | 485.3 | 462.1 | 31/01/2018 |
| 37 | 55 | 18 | McLaughlin & Harvey | 422.7 | 465.8 | 31/12/2018 |
| 38 | 35 | -3 | Keltbray | 399.3 | 417.5 | 31/10/2018 |
| 39 | 42 | 3 | McAleer & Rushe | 395.2 | 334.1 | 31/12/2018 |
| 40 | 40 | 0 | Imtech | 390.0 | 368.0 | 31/12/2018 |
| 41 | 37 | -4 | JRL Group | 388.3 | 288.6 | 31/12/2017 |
| 42 | 38 | -4 | Northstone (NI)* | 374.6 | 375.2 | 31/12/2018 |
| 43 | 46 | 3 | Watkin Jones | 363.1 | 301.9 | 30/09/2018 |
| 44 | 48 | 4 | NMCN | 340.5 | 302.3 | 31/12/2018 |
| 45 | 49 | 4 | Higgins Group | 332.2 | 290.6 | 31/07/2018 |
| 46 | 45 | -1 | T Clarke | 326.8 | 311.2 | 31/12/2018 |
| 47 | 61 | 14 | John Sisk & Son* | 323.2 | 188.5 | 31/12/2018 |
| 48 | 41 | -7 | Osborne | 318.3 | 348.1 | 31/03/2018 |
| 49 | 43 | -6 | SSE Contracting | 317.9 | 330.0 | 31/03/2018 |
| 50 | 58 | 8 | FM Conway* | 317.4 | 297.4 | 31/03/2019 |
| 51 | NEW | - | JN Bentley | 307.9 | 257.3 | 31/12/2018 |
| 52 | NEW | - | OHOB | 300.3 | 306.8 | 31/03/2019 |
| 53 | NEW | - | Ferrovial Agroman UK | 295.7 | 332.6 | 31/12/2018 |
| 54 | 51 | -3 | Severfield | 274.9 | 274.2 | 21/03/2019 |
| 55 | 63 | 8 | MV Kelly | 269.1 | 233.0 | 31/05/2018 |
| 56 | 52 | -4 | Clancy | 268.3 | 267.5 | 31/03/2018 |
| 57 | 70 | 13 | Forth Holdings | 260.0 | 204.6 | 31/08/2018 |
| 58 | 56 | -2 | Midas Group | 259.3 | 267.4 | 30/04/2019 |
| 59 | 39 | -20 | Ardmore | 257.9 | 370.7 | 30/09/2018 |
| 60 | 50 | -10 | RG Carter | 243.3 | 286.4 | 31/12/2017 |
| 61 | 60 | -1 | United Living Group | 240.1 | 180.7 | 31/03/2018 |
| 62 | 53 | -9 | Ogilvie | 236.9 | 269.4 | 30/06/2018 |
| 63 | 57 | -6 | Spie* | 229.0 | 241.8 | 31/12/2018 |
| 64 | 64 | 0 | Rydon Group | 223.7 | 227.5 | 30/09/2018 |
| 65 | 75 | 10 | Briggs & Forrester | 222.4 | 181.7 | 31/10/2018 |
| 66 | 71 | 5 | Bechtel | 219.4 | 201.5 | 31/12/2018 |
| 67 | 88 | 21 | Caddick Group | 212.3 | 146.3 | 31/08/2018 |
| 68 | 66 | -2 | William Hare | 204.5 | 217.8 | 31/12/2017 |
| 69 | 62 | -7 | Esh | 202.6 | 234.1 | 31/12/2017 |
| 70 | 87 | 17 | RGCM | 196.1 | 147.4 | 31/12/2017 |
| 71 | NEW | - | Permasteelisa | 191.8 | 204.4 | 31/03/2018 |
| 72 | 73 | 1 | Cruden Holdings | 188.6 | 200.6 | 31/03/2018 |
| 73 | 79 | 6 | SDC | 186.5 | 164.6 | 30/09/2018 |
| 74 | NEW | - | Barhale | 185.6 | 121.8 | 30/06/2018 |
| 75 | 82 | 7 | Alun Griffiths | 182.4 | 154.3 | 31/12/2017 |
| 76 | 95 | 19 | Actavo | 179.8 | 178.8 | 31/12/2017 |
| 77 | 86 | 9 | Gilbert Ash | 179.4 | 165.5 | 31/12/2018 |
| 78 | 77 | -1 | Clugston | 175.4 | 118.2 | 31/01/2018 |
| 79 | 69 | -10 | Seddon | 175.0 | 204.8 | 31/12/2018 |
| 80 | 54 | -26 | Cape Industrial Services* | 173.9 | 256.1 | 31/08/2018 |
| 81 | 78 | -3 | Babcock Rail | 173.4 | 251.1 | 31/03/2018 |
| 82 | 67 | -15 | Michael J Lonsdale | 173.3 | 215.3 | 30/09/2018 |
| 83 | 68 | -15 | Morrisroe Group | 166.3 | 214.4 | 31/10/2018 |
| 84 | 93 | 9 | Durkan Holdings | 164.9 | 140.5 | 30/11/2018 |
| 85 | 84 | -1 | Lindum | 163.8 | 149.9 | 30/11/2018 |
| 86 | 72 | -14 | Eric Wright Group | 159.1 | 201.4 | 31/12/2017 |
| 87 | 85 | -2 | Novus | 158.4 | 151.1 | 31/12/2018 |
| 88 | 80 | -8 | One Group Construction | 157.1 | 162.6 | 31/12/2018 |
| 89 | NEW | - | Stepnell | 156.5 | 137.5 | 31/03/2018 |
| 90 | 90 | 0 | Dodd Group | 154.1 | 144.4 | 31/03/2018 |
| 91 | NEW | - | HG Construction | 152.6 | 126.4 | 31/12/2018 |
| 92 | 89 | -3 | Gratte Brothers | 150.3 | 146.0 | 31/03/2018 |
| 93 | 91 | -2 | E W Beard | 149.8 | 144.1 | 31/12/2018 |
| 94 | NEW | - | Masterson Holdings | 149.2 | 129.2 | 31/08/2018 |
| 95 | 98 | 3 | Wood Group | 149.1 | 135.3 | 31/12/2017 |
| 96 | 97 | 1 | Mulalley & Company | 148.0 | 135.5 | 31/03/2019 |
| 97 | 83 | -14 | Erith | 147.7 | 152.9 | 30/09/2018 |
| 98 | NEW | - | Mount Anvil | 146.9 | 97.9 | 31/12/2017 |
| 99 | 44 | -55 | Byrne Group | 138.7 | 321.7 | 30/06/2018 |
| 100 | 65 | -35 | City Building (Glasgow) | 137.7 | 219.2 | 31/03/2018 |
Mace/Murphy Group = Latest data taken from unaudited partial results | Colas = Colas now desegregated from Bouygues UK | Engie Regeneration = Latest data taken for 15-month period; Previous data was for 18-month period | Buckingham Group, Imtech, Seddon = Figures provided by management | Cape Industrial Services = Latest accounts cover an 8-month period | McLaughlin & Harvey, Actavo = Previously used subsidiary company | NMCN = Previously reported as North Midland Construction | * = Two years of accounts filed since CN100 2018
"That was really well articulated by Balfour Beatty earlier this year, it's taken them about three or four years to get all of the problem projects out of their portfolio."
It appears that at last, on average, the UK's biggest firms are finally in the 2-3 per cent range that so many refer to as the "industry average".
Improvements over the past year have also helped that symbolic group of the top 10 largest firms, which account for almost half of all turnover in the CN100, report their first year-on-year improvement in average pre-tax margin for five years.

This year's CN100 sees the top 10 record an average margin of -0.1 per cent, an improvement from the -0.9 per cent seen the previous year.
There is one firm, however, that skews not just the collective performance of the tier one giants, but the entire CN100 – Amey.
In its latest results it posted a huge £428m pre-tax loss as it made massive writedowns to its goodwill and paid heavily to end a PFI road maintenance deal early.
Removing this outlier sees the average margin for the top 10 jump from -0.1 per cent to 1.4 per cent. For the entire CN100 the margin increases from 1.4 per cent to 2.1 per cent.
Focus on the bottom line
These improvements in margin have come as turnover growth has slowed overall.
Across the piece, turnover increased just 2.6 per cent in the year, rising to £66.8bn. This is significantly lower growth than last year's CN100 when total revenue increased almost three times faster at 7.6 per cent.
"We've been very conscious not to chase turnover unless there's profit. That was a decision about three years ago that was probably against the trend then"
Andy Steele, Osborne
Slower revenue growth is partly a reflection of a slower overall market.
In the two-year period from April 2017 to March 2019, which captures the start to end trading period for most of this year's CN100, construction output increased less than 1 per cent according to the ONS. In the two years prior to that, output increased by 10 per cent.
Perhaps more importantly though, many firms are now not targeting turnover growth.
EY head of construction transaction advisory Ian Marson says: "I think the key driver [of lower turnover] is probably the firms themselves have started to prioritise margin."
Mr Marson has worked with four businesses in the CN100's top 10 in recent months and each of them has a policy of driving margins higher and focusing on contract approvals.
"They've talked about that many times, but I've never actually seen them really tighten up their governance before. And that does appear to be having an effect," he says.
CN100: PROFIT AND MARGINS
| CN100 2019 rank | Company | Pre-tax profit (£m) – latest | Pre-tax profit (£m) – previous | Pre-tax margin – latest | Pre-tax margin – previous | Accounting year ending |
|---|---|---|---|---|---|---|
| 1 | Balfour Beatty | 123.0 | 117.0 | 1.9% | 1.7% | 31/12/2018 |
| 2 | Kier | 106.2 | -14.2 | 2.5% | -0.3% | 30/06/2018 |
| 3 | Morgan Sindall | 80.6 | 64.9 | 2.7% | 2.3% | 31/12/2018 |
| 4 | Galliford Try | 143.7 | 58.7 | 4.9% | 2.2% | 30/06/2018 |
| 5 | Interserve | -111.3 | -244.4 | -3.8% | -7.5% | 31/12/2018 |
| 6 | Laing ORourke | -43.6 | -66.9 | -1.6% | -2.3% | 31/03/2018 |
| 7 | Mace | 33.0 | 17.2 | 1.4% | 0.9% | 31/12/2018 |
| 8 | Amey | 0.0 | -189.8 | 0.0% | -8.6% | 31/12/2018 |
| 9 | ISG | 27.4 | 9.1 | 1.2% | 0.5% | 31/12/2018 |
| 10 | Skanska UK | 44.1 | 13.5 | 2.3% | 0.7% | 31/12/2018 |
| 11 | Wates | 34.4 | 32.9 | 2.3% | 2.1% | 31/12/2018 |
| 12 | Costain | 40.2 | 41.8 | 2.7% | 2.5% | 31/12/2018 |
| 13 | Willmott Dixon | 35.5 | 33.5 | 2.7% | 2.6% | 31/12/2018 |
| 14 | Multiplex | 18.0 | 4.2 | 1.7% | 0.4% | 31/12/2018 |
| 15 | VolkerWessels UK | 29.0 | 23.6 | 2.9% | 2.7% | 31/12/2018 |
| 16 | Bam Construct | 19.4 | 14.8 | 2.0% | 1.6% | 31/12/2018 |
| 17 | Bouygues UK | -16.4 | -68.7 | -1.7% | -7.8% | Various |
| 18 | Bowmer and Kirkland | 54.5 | 64.4 | 5.8% | 6.9% | 31/08/2018 |
| 19 | Vinci | 13.8 | 22.4 | 1.6% | 2.6% | 31/12/2018 |
| 20 | Sir Robert McAlpine | 0.7 | -20.2 | 0.1% | -2.1% | 31/10/2018 |
| 21 | Murphy Group | -5.8 | 12.4 | -0.7% | 1.7% | 31/12/2018 |
| 22 | Morrison Utility Services | 25.5 | 23.6 | 3.3% | 3.6% | 31/03/2018 |
| 23 | Engie Regeneration | 10.8 | -72.7 | 1.4% | -10.9% | 31/12/2018 |
| 24 | Bam Nuttall | 26.3 | 7.8 | 3.5% | 1.2% | 31/12/2018 |
| 25 | Graham | 8.2 | 13.1 | 1.1% | 1.7% | 31/03/2019 |
| 26 | Robertson | 24.2 | 31.0 | 3.4% | 4.1% | 31/03/2019 |
| 27 | McLaren | 3.7 | 3.2 | 0.6% | 0.5% | 31/07/2018 |
| 28 | Lendlease | 28.3 | 12.5 | 5.0% | 3.3% | Various |
| 29 | NG Bailey | 16.1 | 19.6 | 2.9% | 4.1% | 01/03/2019 |
| 30 | Renew | 14.7 | 19.8 | 2.7% | 3.6% | 30/09/2018 |
| 31 | Colas | 14.1 | 14.1 | 2.6% | 3.0% | Various |
| 32 | Carey Group | 18.7 | 19.1 | 3.7% | 3.5% | 31/03/2018 |
| 33 | Buckingham Group | 10.3 | 14.4 | 2.0% | 3.4% | 31/12/2018 |
| 34 | Hill Holdings | 48.3 | 47.2 | 9.6% | 11.4% | 31/12/2018 |
| 35 | Eurovia Group | 13.2 | 22.2 | 2.6% | 4.6% | 31/12/2018 |
| 36 | Winvic | 31.3 | 28.5 | 6.5% | 6.2% | 31/01/2018 |
| 37 | McLaughlin & Harvey | 11.3 | 11.1 | 2.7% | 2.4% | 31/12/2018 |
| 38 | Keltbray | 17.8 | 23.4 | 4.5% | 5.6% | 31/10/2018 |
| 39 | McAleer & Rushe | 16.8 | 13.4 | 4.2% | 4.0% | 31/12/2018 |
| 40 | Imtech | 8.9 | 0.9 | 2.3% | 0.2% | 31/12/2018 |
| 41 | JRL Group | 27.1 | 16.2 | 7.0% | 5.6% | 31/12/2017 |
| 42 | Northstone (NI) | 7.5 | -0.2 | 2.0% | -0.1% | 31/12/2018 |
| 43 | Watkin Jones | 54.3 | 43.3 | 15.0% | 14.3% | 30/09/2018 |
| 44 | NMCN | 6.0 | 9.1 | 1.8% | 3.0% | 31/12/2018 |
| 45 | Higgins Group | 0.6 | 6.6 | 0.2% | 2.3% | 31/07/2018 |
| 46 | T Clarke | 7.8 | 7.1 | 2.4% | 2.3% | 31/12/2018 |
| 47 | John Sisk & Son | 3.2 | 0.4 | 1.0% | 0.2% | 31/12/2018 |
| 48 | Osborne | 12.7 | 3.4 | 4.0% | 1.0% | 31/03/2018 |
| 49 | SSE Contracting | -4.6 | -5.0 | -1.4% | -1.5% | 31/03/2018 |
| 50 | FM Conway | 3.6 | 11.7 | 1.1% | 3.9% | 31/03/2019 |
| 51 | JN Bentley | 6.3 | 8.3 | 2.0% | 3.2% | 31/12/2018 |
| 52 | OHOB | 27.0 | 25.6 | 9.0% | 8.3% | 31/03/2019 |
| 53 | Ferrovial Agroman UK | -13.5 | -31.0 | -4.6% | -9.3% | 31/12/2018 |
| 54 | Severfield | 24.7 | 22.2 | 9.0% | 8.1% | 21/03/2019 |
| 55 | MV Kelly | 11.1 | 12.2 | 4.1% | 5.2% | 31/05/2018 |
| 56 | Clancy | -3.6 | 2.0 | -1.3% | 0.8% | 31/03/2018 |
| 57 | Forth Holdings | 6.6 | 12.3 | 2.6% | 6.0% | 31/08/2018 |
| 58 | Midas Group | 0.8 | 0.7 | 0.3% | 0.3% | 30/04/2019 |
| 59 | Ardmore | 25.1 | 15.0 | 9.7% | 4.1% | 30/09/2018 |
| 60 | RG Carter | 2.2 | 8.3 | 0.9% | 2.9% | 31/12/2017 |
| 61 | United Living Group | 8.0 | 6.4 | 3.3% | 3.5% | 31/03/2018 |
| 62 | Ogilvie | 5.8 | 5.4 | 2.4% | 2.0% | 30/06/2018 |
| 63 | Spie | 7.4 | -27.9 | 3.2% | -11.5% | 31/12/2018 |
| 64 | Rydon Group | 20.8 | 9.2 | 9.3% | 4.1% | 30/09/2018 |
| 65 | Briggs & Forrester | 6.5 | 5.7 | 2.9% | 3.1% | 31/10/2018 |
| 66 | Bechtel | 7.5 | 19.1 | 3.4% | 9.5% | 31/12/2018 |
| 67 | Caddick Group | 10.9 | 8.0 | 5.1% | 5.4% | 31/08/2018 |
| 68 | William Hare | 3.2 | 2.4 | 1.6% | 1.1% | 31/12/2017 |
| 69 | Esh | 0.4 | 3.8 | 0.2% | 1.6% | 31/12/2017 |
| 70 | RGCM | 0.4 | 1.4 | 0.2% | 1.0% | 31/12/2017 |
| 71 | Permasteelisa | -1.9 | -2.8 | -1.0% | -1.3% | 31/03/2018 |
| 72 | Cruden Holdings | 9.1 | 10.5 | 4.8% | 5.2% | 31/03/2018 |
| 73 | SDC | 2.0 | 1.4 | 1.1% | 0.9% | 30/09/2018 |
| 74 | Barhale | 3.1 | 2.2 | 1.7% | 1.8% | 30/06/2018 |
| 75 | Alun Griffiths | 1.0 | 2.3 | 0.5% | 1.5% | 31/12/2017 |
| 76 | Actavo | -26.1 | -7.6 | -14.5% | -4.3% | 31/12/2017 |
| 77 | Gilbert Ash | 7.7 | 2.1 | 4.3% | 1.3% | 31/12/2018 |
| 78 | Clugston | -0.5 | 1.0 | -0.3% | 0.9% | 31/01/2018 |
| 79 | Seddon | 1.6 | 5.3 | 0.9% | 2.6% | 31/12/2018 |
| 80 | Cape Industrial Services | 7.5 | 17.8 | 4.3% | 7.0% | 31/08/2018 |
| 81 | Babcock Rail | 1.9 | 12.2 | 1.1% | 4.9% | 31/03/2018 |
| 82 | Michael J Lonsdale | 7.6 | 7.1 | 4.4% | 3.3% | 30/09/2018 |
| 83 | Morrisroe Group | 15.7 | 16.2 | 9.4% | 7.5% | 31/10/2018 |
| 84 | Durkan Holdings | 7.9 | 9.2 | 4.8% | 6.6% | 30/11/2018 |
| 85 | Lindum | 7.8 | 7.3 | 4.8% | 4.8% | 30/11/2018 |
| 86 | Eric Wright Group | 5.7 | 6.0 | 3.6% | 3.0% | 31/12/2017 |
| 87 | Novus | 7.1 | 9.6 | 4.5% | 6.4% | 31/12/2018 |
| 88 | One Group Construction | 5.3 | 6.4 | 3.4% | 3.9% | 31/12/2018 |
| 89 | Stepnell | 10.7 | 0.8 | 6.9% | 0.6% | 31/03/2018 |
| 90 | Dodd Group | 3.9 | 3.9 | 2.5% | 2.7% | 31/03/2018 |
| 91 | HG Construction | 12.7 | 8.6 | 8.3% | 6.8% | 31/12/2018 |
| 92 | Gratte Brothers | 2.0 | 1.4 | 1.3% | 1.0% | 31/03/2018 |
| 93 | E W Beard | 4.4 | 3.9 | 2.9% | 2.7% | 31/12/2018 |
| 94 | Masterson Holdings | 11.1 | 10.5 | 7.4% | 8.1% | 31/08/2018 |
| 95 | Wood Group | 8.8 | 13.9 | 5.9% | 10.3% | 31/12/2017 |
| 96 | Mulalley & Company | 2.8 | 4.4 | 1.9% | 3.3% | 31/03/2019 |
| 97 | Erith | 4.0 | 10.2 | 2.7% | 6.7% | 30/09/2018 |
| 98 | Mount Anvil | 0.3 | 1.8 | 0.2% | 1.8% | 31/12/2017 |
| 99 | Byrne Group | -8.2 | 1.7 | -5.9% | 0.5% | 30/06/2018 |
| 100 | City Building (Glasgow) | -5.3 | -5.6 | -3.9% | -2.6% | 31/03/2018 |
Wates is emblematic of the change in attitude seen at some contractors.
Back in 2015, the construction industry looked to finally be free of the long-lasting pain caused by the financial crisis. Wates' chief executive at the time Andrew Davies, now at Kier, set a goal to match the new optimistic environment and wanted to see turnover grow from £1.6bn to £2bn.
"We've stepped away from our previous announced intention to grow the business to £2bn, that isn't our focus," says David Allen, the firm's current CEO.
"If we can maintain our profitability and the strength of our balance sheet, we are much less concerned about the level of turnover."

In its most recent year, turnover at Wates fell from £1.53bn to £1.5bn, but its margin rose from 2.1 per cent to 2.3 per cent.
A more conservative approach to trading is not the preserve of the largest firms, however.
Turnover for Osborne fell from £348m to £318m, but pre-tax profit has risen from £3.6m to £12.7m, albeit with the help of some property development work. Chief executive Andy Steele says the fall in turnover is the result of deliberate action.
"We've been very conscious not to chase turnover unless there's profit with it," Mr Steele says.
"That was a decision we put into the business plan about three or four years ago that was probably against the trend then.
"I looked at the volatility of the market, and just went, 'you know what, why would we just try and grow?'"
Healthy growth still exists
With political and economic uncertainty prevailing since mid-2016, going after growth has been too much of a risk for some. But there are firms in our list that have managed to increase the top line while keeping the bottom line healthy.
Buckingham Group saw its turnover jump almost 20 per cent from £423m to £507m in 2018. Its pre-tax margin has come down from around 3.4 per cent, but has held at a reasonable 2 per cent.
Managing director Mike Kempley says being a leader in a niche has been a big help for the business.
"We're not generalists, really we operate in four or five different niches where we were leading players in those niches," he says.
Sports and leisure is such a market where Buckingham Group stands out, and its work in the sector added around £50m to turnover in 2018, Mr Kempley says.
Similar patterns of high growth accompanied by healthy margins can be seen in other specialist leaders, such as Winvic (warehouses and logistic centres) and Gilbert-Ash (cultural and historic buildings).
Growth alongside good margins is not confined to these areas, however. Morgan Sindall jumps from fifth to third in our list as its turnover increased from £2.79bn to £2.97bn. At the same time, its pre-tax margin also rose from 2.3 per cent to 2.7 per cent.
CEO John Morgan insists profitable jobs are out there to be won and executed, contractors just have to work a little a harder to pull them off.
"Construction is such a huge industry and nobody has huge market share," he says. "So, it's all about getting out of bed a bit earlier than everybody else in the morning and being a bit better."
The Carillion effect
This year's CN100 is the first true post-Carillion look at the rest of the large contractors in the UK, with the accounts of all bar a tiny minority covering the months following its collapse.
"Carillion was a bit of a wakeup call to people. If Carillion can go bust, anyone can"
John Morgan, Morgan Sindall
Arguably the key figure that people focus on when it comes to financial resilience is cash reserves.
This year's data shows total cash and equivalents held by the top 100 has dropped by more than half a billion pounds to £7.84bn.
Such a drop in cash might ring alarm bells and raise the question whether contractors have learned anything from Carillion. The £4bn turnover giant had just £29m in the bank when it went into liquidation on 15 January last year.
However, when we add in the context of borrowing, the picture changes.
Total debt held by the top 100 has fallen more, dropping by over £650m to £4.61bn. In percentage terms, cash levels fell by just over 6 per cent, but borrowing fell by almost 12.5 per cent.
CN100: CASH AND BORROWING
| CN100 2019 Rank | Company | Cash - Latest | Cash - Previous | Total Borrowing - Latest | Total Borrowing - Previous | Accounting Year Ending |
|---|---|---|---|---|---|---|
| 1 | Balfour Beatty | 661.0 | 968.0 | 633.0 | 938.0 | 31/12/2018 |
| 2 | Kier | 330.9 | 499.8 | 536.9 | 631.8 | 30/06/2018 |
| 3 | Morgan Sindall | 217.2 | 221.2 | 10.2 | 27.8 | 31/12/2018 |
| 4 | Galliford Try | 912.4 | 1145.9 | 814.2 | 1138.7 | 30/06/2018 |
| 5 | Interserve | 196.7 | 155.1 | 827.5 | 654.3 | 31/12/2018 |
| 6 | Laing ORourke | 357.0 | 324.0 | 284.5 | 266.7 | 31/03/2018 |
| 7 | Mace | 192.7 | 192.7 | 161.5 | 161.5 | 31/12/2018 |
| 8 | Amey | 164.3 | 215.9 | 456.4 | 458.7 | 31/12/2018 |
| 9 | ISG | 102.8 | 75.7 | 25.4 | 11.8 | 31/12/2018 |
| 10 | Skanska UK | 373.9 | 293.7 | 9.5 | 8.8 | 31/12/2018 |
| 11 | Wates | 114.2 | 169.5 | 26.1 | 20.8 | 31/12/2018 |
| 12 | Costain | 189.3 | 248.7 | 70.5 | 71.0 | 31/12/2018 |
| 13 | Willmott Dixon | 90.5 | 82.8 | 0.0 | 0.0 | 31/12/2018 |
| 14 | Multiplex | 50.0 | 61.2 | 0.0 | 0.0 | 31/12/2018 |
| 15 | VolkerWessels UK | 134.4 | 128.4 | 1.8 | 1.3 | 31/12/2018 |
| 16 | Bam Construct | 82.9 | 82.3 | 0.0 | 0.0 | 31/12/2018 |
| 17 | Bouygues UK | 239.6 | 292.4 | 48.0 | 48.0 | Various |
| 18 | Bowmer and Kirkland | 408.6 | 315.5 | 0.0 | 40.6 | 31/08/2018 |
| 19 | Vinci | 275.3 | 210.3 | 8.5 | 22.0 | 31/12/2018 |
| 20 | Sir Robert McAlpine | 162.2 | 205.9 | 139.0 | 177.4 | 31/10/2018 |
| 21 | Murphy Group | 63.3 | 62.0 | - | 0.0 | 31/12/2018 |
| 22 | Morrison Utility Services | 19.9 | 21.5 | 0.0 | 0.0 | 31/03/2018 |
| 23 | Engie Regeneration | 54.3 | 18.5 | 0.0 | 0.0 | 31/12/2018 |
| 24 | Bam Nuttall | 126.4 | 108.8 | 0.0 | 0.0 | 31/12/2018 |
| 25 | Graham | 62.9 | 70.1 | 5.1 | 5.6 | 31/03/2019 |
| 26 | Robertson | 136.7 | 141.5 | 34.7 | 37.7 | 31/03/2019 |
| 27 | McLaren | 37.8 | 54.1 | 0.0 | 0.0 | 31/07/2018 |
| 28 | Lendlease | 68.8 | 66.7 | 2.4 | 0.0 | Various |
| 29 | NG Bailey | 14.0 | 14.5 | 23.3 | 0.0 | 01/03/2019 |
| 30 | Renew | 9.2 | 7.0 | 30.6 | 3.1 | 30/09/2018 |
| 31 | Colas | 33.7 | 28.3 | 0.0 | 0.0 | Various |
| 32 | Carey Group | 15.1 | 20.2 | 23.0 | 18.6 | 31/03/2018 |
| 33 | Buckingham Group | 65.4 | 64.4 | 0.0 | 0.0 | 31/12/2018 |
| 34 | Hill Holdings | 65.0 | 75.5 | 48.9 | 88.1 | 31/12/2018 |
| 35 | Eurovia Group | 57.9 | 75.1 | 9.4 | 15.3 | 31/12/2018 |
| 36 | Winvic | 76.5 | 53.5 | 0.0 | 0.0 | 31/01/2018 |
| 37 | McLaughlin & Harvey | 56.4 | 49.5 | 0.0 | 0.0 | 31/12/2018 |
| 38 | Keltbray | 30.8 | 50.0 | 0.0 | 0.0 | 31/10/2018 |
| 39 | McAleer & Rushe | 59.4 | 47.4 | 0.0 | 0.0 | 31/12/2018 |
| 40 | Imtech | 22.2 | 29.3 | 24.7 | 30.5 | 31/12/2018 |
| 41 | JRL Group | 30.9 | 32.7 | 37.6 | 27.6 | 31/12/2017 |
| 42 | Northstone (NI) | 14.2 | 19.2 | 0.0 | 0.0 | 31/12/2018 |
| 43 | Watkin Jones | 106.6 | 65.3 | 26.5 | 24.3 | 30/09/2018 |
| 44 | NMCN | 33.4 | 17.0 | 0.0 | 0.0 | 31/12/2018 |
| 45 | Higgins Group | 21.1 | 34.4 | 42.0 | 49.7 | 31/07/2018 |
| 46 | T Clarke | 12.4 | 16.7 | 0.0 | 5.0 | 31/12/2018 |
| 47 | John Sisk & Son | 46.0 | 11.6 | 0.0 | 0.0 | 31/12/2018 |
| 48 | Osborne | 31.9 | 24.6 | 2.0 | 6.2 | 31/03/2018 |
| 49 | SSE Contracting | 0.5 | 0.1 | 0.0 | 0.0 | 31/03/2018 |
| 50 | FM Conway | 19.8 | 15.3 | 58.2 | 71.8 | 31/03/2019 |
| 51 | JN Bentley | 1.3 | 6.6 | 0.0 | 0.0 | 31/12/2018 |
| 52 | OHOB | 26.5 | 26.1 | 0.0 | 0.0 | 31/03/2019 |
| 53 | Ferrovial Agroman UK | 94.4 | 72.2 | 0.0 | 0.0 | 31/12/2018 |
| 54 | Severfield | 25.0 | 33.1 | 0.0 | 0.0 | 21/03/2019 |
| 55 | MV Kelly | 9.8 | 11.2 | 0.0 | 0.0 | 31/05/2018 |
| 56 | Clancy | 0.0 | 3.5 | 12.0 | 16.3 | 31/03/2018 |
| 57 | Forth Holdings | 51.4 | 17.3 | 10.6 | 11.9 | 31/08/2018 |
| 58 | Midas Group | 22.7 | 26.8 | 0.0 | 0.0 | 30/04/2019 |
| 59 | Ardmore | 73.0 | 96.6 | 1.0 | 1.1 | 30/09/2018 |
| 60 | RG Carter | 66.4 | 77.7 | 0.0 | 0.0 | 31/12/2017 |
| 61 | United Living Group | 20.6 | 7.2 | 0.0 | 0.0 | 31/03/2018 |
| 62 | Ogilvie | 0.0 | 15.4 | 0.0 | 0.0 | 30/06/2018 |
| 63 | Spie | 4.5 | 11.8 | 0.0 | 0.0 | 31/12/2018 |
| 64 | Rydon Group | 33.9 | 36.8 | 0.0 | 0.0 | 30/09/2018 |
| 65 | Briggs & Forrester | 34.7 | 32.5 | 2.9 | 2.5 | 31/10/2018 |
| 66 | Bechtel | 0.3 | 0.1 | 0.0 | 0.0 | 31/12/2018 |
| 67 | Caddick Group | 29.3 | 33.5 | 8.8 | 19.7 | 31/08/2018 |
| 68 | William Hare | 6.6 | 15.2 | 0.0 | 0.0 | 31/12/2017 |
| 69 | Esh | 20.0 | 25.7 | 18.2 | 19.0 | 31/12/2017 |
| 70 | RGCM | 9.1 | 7.5 | 0.0 | 0.0 | 31/12/2017 |
| 71 | Permasteelisa | 0.1 | 0.1 | 0.0 | 0.0 | 31/03/2018 |
| 72 | Cruden Holdings | 39.2 | 42.0 | 7.2 | 1.0 | 31/03/2018 |
| 73 | SDC | 15.1 | 14.9 | 0.0 | 0.0 | 30/09/2018 |
| 74 | Barhale | 7.3 | 5.6 | 0.0 | 0.0 | 30/06/2018 |
| 75 | Alun Griffiths | 9.0 | 12.4 | 0.0 | 1.4 | 31/12/2017 |
| 76 | Actavo | 9.2 | 3.4 | 16.2 | 15.5 | 31/12/2017 |
| 77 | Gilbert Ash | 40.7 | 28.1 | 0.0 | 0.0 | 31/12/2018 |
| 78 | Clugston | 30.0 | 18.1 | 0.0 | 0.0 | 31/01/2018 |
| 79 | Seddon | 8.7 | 18.6 | 0.3 | 0.4 | 31/12/2018 |
| 80 | Cape Industrial Services | 23.6 | 13.6 | 0.0 | 0.0 | 31/08/2018 |
| 81 | Babcock Rail | 12.4 | 24.2 | 5.7 | 5.7 | 31/03/2018 |
| 82 | Michael J Lonsdale | 33.2 | 42.2 | 0.0 | 0.0 | 30/09/2018 |
| 83 | Morrisroe Group | 70.9 | 68.2 | 0.0 | 0.0 | 31/10/2018 |
| 84 | Durkan Holdings | 35.4 | 35.4 | 10.8 | 7.1 | 30/11/2018 |
| 85 | Lindum | 24.6 | 22.1 | 0.0 | 0.0 | 30/11/2018 |
| 86 | Eric Wright Group | 17.4 | 14.8 | 68.5 | 58.0 | 31/12/2017 |
| 87 | Novus | 10.2 | 10.9 | 0.0 | 0.0 | 31/12/2018 |
| 88 | One Group Construction | 28.7 | 32.3 | 2.4 | 2.9 | 31/12/2018 |
| 89 | Stepnell | 26.0 | 25.3 | 9.2 | 10.6 | 31/03/2018 |
| 90 | Dodd Group | 21.6 | 24.4 | 0.0 | 0.0 | 31/03/2018 |
| 91 | HG Construction | 36.6 | 30.9 | 0.2 | 0.3 | 31/12/2018 |
| 92 | Gratte Brothers | 11.7 | 9.1 | 0.0 | 0.0 | 31/03/2018 |
| 93 | E W Beard | 26.3 | 24.0 | 0.0 | 0.0 | 31/12/2018 |
| 94 | Masterson Holdings | 56.1 | 48.5 | 0.0 | 0.0 | 31/08/2018 |
| 95 | Wood Group | 22.6 | 21.3 | 0.0 | 0.0 | 31/12/2017 |
| 96 | Mulalley & Company | 8.4 | 4.2 | 0.0 | 0.0 | 31/03/2019 |
| 97 | Erith | 7.7 | 9.5 | 9.1 | 9.4 | 30/09/2018 |
| 98 | Mount Anvil | 19.2 | 12.9 | 0.0 | 0.0 | 31/12/2017 |
| 99 | Byrne Group | 4.6 | 5.7 | 2.2 | 16.3 | 30/06/2018 |
| 100 | City Building (Glasgow) | 6.0 | 6.9 | 0.0 | 0.0 | 31/03/2018 |
So as cash reserves have dropped, debt has fallen much faster, and most of the debt cutting has taken place among the largest contractors: Carillion's peers, who tend to make greater use of bank finance in general.
Among these largest firms we also see resilience being built as working capital ratios (also known as current ratios) increased.
The average working capital ratio for the largest firms rose marginally to 1.08, up from 1.07 last year. In other words, for every £1 of liabilities they have to pay in the next 12 months they have £1.08.
However, this is skewed again by Amey, as its cover has dropped from 0.93 to 0.7. Remove the company and the average for the top 10 jumps to 1.11 versus 1.08 last year.
Being able to show a strong balance sheet, which means good liquidity, adequate working capital levels, and low leverage has become increasingly important in the past 18 months.
Across the rest of the CN100, where working capital ratios are generally healthier, there is little change, with levels fluctuating between 1.17 and 1.28.
CN100: WORKING CAPITAL RATIO
| CN100 2019 Rank | Company | Working Capital - Latest | Working Capital - Previous | Accounting Year Ending |
|---|---|---|---|---|
| 1 | Balfour Beatty | 0.95 | 0.92 | 31/12/2018 |
| 2 | Kier | 0.99 | 1.08 | 30/06/2018 |
| 3 | Morgan Sindall | 1.06 | 1.03 | 31/12/2018 |
| 4 | Galliford Try | 1.37 | 1.23 | 30/06/2018 |
| 5 | Interserve | 1.13 | 1.06 | 31/12/2018 |
| 6 | Laing ORourke | 0.85 | 0.79 | 31/03/2018 |
| 7 | Mace | 1.11 | 1.11 | 31/12/2018 |
| 8 | Amey | 0.70 | 0.93 | 31/12/2018 |
| 9 | ISG | 0.88 | 0.76 | 31/12/2018 |
| 10 | Skanska UK | 1.78 | 1.91 | 31/12/2018 |
| 11 | Wates | 1.00 | 1.02 | 31/12/2018 |
| 12 | Costain | 1.43 | 1.28 | 31/12/2018 |
| 13 | Willmott Dixon | 1.50 | 1.40 | 31/12/2018 |
| 14 | Multiplex | 1.39 | 1.58 | 31/12/2018 |
| 15 | VolkerWessels UK | 1.04 | 1.10 | 31/12/2018 |
| 16 | Bam Construct | 1.32 | 1.32 | 31/12/2018 |
| 17 | Bouygues UK | 1.04 | 1.10 | Various |
| 18 | Bowmer and Kirkland | 1.70 | 1.70 | 31/08/2018 |
| 19 | Vinci | 1.01 | 0.99 | 31/12/2018 |
| 20 | Sir Robert McAlpine | 1.87 | 2.00 | 31/10/2018 |
| 21 | Murphy Group | - | 1.50 | 31/12/2018 |
| 22 | Morrison Utility Services | 1.94 | 1.95 | 31/03/2018 |
| 23 | Engie Regeneration | 1.14 | 0.91 | 31/12/2018 |
| 24 | Bam Nuttall | 1.41 | 1.40 | 31/12/2018 |
| 25 | Graham | 1.20 | 1.20 | 31/03/2019 |
| 26 | Robertson | 1.22 | 1.27 | 31/03/2019 |
| 27 | McLaren | 1.13 | 1.13 | 31/07/2018 |
| 28 | Lendlease | 1.63 | 1.59 | Various |
| 29 | NG Bailey | 1.38 | 1.49 | 01/03/2019 |
| 30 | Renew | 0.73 | 0.72 | 30/09/2018 |
| 31 | Colas | 1.16 | 0.94 | Various |
| 32 | Carey Group | 1.35 | 1.36 | 31/03/2018 |
| 33 | Buckingham Group | 1.26 | 1.30 | 31/12/2018 |
| 34 | Hill Holdings | 2.00 | 2.13 | 31/12/2018 |
| 35 | Eurovia Group | 0.98 | 1.12 | 31/12/2018 |
| 36 | Winvic | 1.53 | 1.32 | 31/01/2018 |
| 37 | McLaughlin & Harvey | 1.17 | 1.15 | 31/12/2018 |
| 38 | Keltbray | 1.10 | 1.01 | 31/10/2018 |
| 39 | McAleer & Rushe | 1.59 | 1.34 | 31/12/2018 |
| 40 | Imtech | 1.14 | 1.10 | 31/12/2018 |
| 41 | JRL Group | 1.09 | 1.05 | 31/12/2017 |
| 42 | Northstone (NI) | 1.10 | 1.23 | 31/12/2018 |
| 43 | Watkin Jones | 2.44 | 2.29 | 30/09/2018 |
| 44 | NMCN | 1.00 | 0.95 | 31/12/2018 |
| 45 | Higgins Group | 1.28 | 1.46 | 31/07/2018 |
| 46 | T Clarke | 1.11 | 1.10 | 31/12/2018 |
| 47 | John Sisk & Son | 1.40 | 1.07 | 31/12/2018 |
| 48 | Osborne | 1.26 | 1.20 | 31/03/2018 |
| 49 | SSE Contracting | 3.02 | 2.12 | 31/03/2018 |
| 50 | FM Conway | 0.99 | 1.07 | 31/03/2019 |
| 51 | JN Bentley | 1.03 | 1.03 | 31/12/2018 |
| 52 | OHOB | 2.45 | 1.85 | 31/03/2019 |
| 53 | Ferrovial Agroman UK | 1.01 | 1.06 | 31/12/2018 |
| 54 | Severfield | 1.56 | 1.50 | 21/03/2019 |
| 55 | MV Kelly | 1.18 | 1.18 | 31/05/2018 |
| 56 | Clancy | 1.24 | 1.28 | 31/03/2018 |
| 57 | Forth Holdings | 1.17 | 1.21 | 31/08/2018 |
| 58 | Midas Group | 1.12 | 1.11 | 30/04/2019 |
| 59 | Ardmore | 1.13 | 1.02 | 30/09/2018 |
| 60 | RG Carter | 1.69 | 1.65 | 31/12/2017 |
| 61 | United Living Group | 0.72 | 0.67 | 31/03/2018 |
| 62 | Ogilvie | 0.94 | 1.01 | 30/06/2018 |
| 63 | Spie | 1.06 | 1.01 | 31/12/2018 |
| 64 | Rydon Group | 2.02 | 1.59 | 30/09/2018 |
| 65 | Briggs & Forrester | 1.19 | 1.22 | 31/10/2018 |
| 66 | Bechtel | 2.10 | 2.21 | 31/12/2018 |
| 67 | Caddick Group | 2.35 | 2.06 | 31/08/2018 |
| 68 | William Hare | 1.43 | 1.36 | 31/12/2017 |
| 69 | Esh | 1.40 | 1.48 | 31/12/2017 |
| 70 | RGCM | 1.17 | 1.18 | 31/12/2017 |
| 71 | Permasteelisa | 0.98 | 1.16 | 31/03/2018 |
| 72 | Cruden Holdings | 1.51 | 1.54 | 31/03/2018 |
| 73 | SDC | 1.11 | 1.11 | 30/09/2018 |
| 74 | Barhale | 1.09 | 1.06 | 30/06/2018 |
| 75 | Alun Griffiths | 1.03 | 1.00 | 31/12/2017 |
| 76 | Actavo | 0.67 | 0.87 | 31/12/2017 |
| 77 | Gilbert Ash | 1.25 | 1.27 | 31/12/2018 |
| 78 | Clugston | 1.30 | 1.50 | 31/01/2018 |
| 79 | Seddon | 2.19 | 2.26 | 31/12/2018 |
| 80 | Cape Industrial Services | 0.81 | 1.08 | 31/08/2018 |
| 81 | Babcock Rail | 2.81 | 2.58 | 31/03/2018 |
| 82 | Michael J Lonsdale | 1.14 | 1.08 | 30/09/2018 |
| 83 | Morrisroe Group | 1.92 | 1.63 | 31/10/2018 |
| 84 | Durkan Holdings | 1.58 | 1.87 | 30/11/2018 |
| 85 | Lindum | 1.57 | 1.53 | 30/11/2018 |
| 86 | Eric Wright Group | 2.67 | 1.87 | 31/12/2017 |
| 87 | Novus | 1.58 | 1.71 | 31/12/2018 |
| 88 | One Group Construction | 0.95 | 0.94 | 31/12/2018 |
| 89 | Stepnell | 2.11 | 1.99 | 31/03/2018 |
| 90 | Dodd Group | 1.82 | 1.84 | 31/03/2018 |
| 91 | HG Construction | 1.41 | 1.28 | 31/12/2018 |
| 92 | Gratte Brothers | 1.09 | 1.04 | 31/03/2018 |
| 93 | E W Beard | 1.23 | 1.17 | 31/12/2018 |
| 94 | Masterson Holdings | 1.28 | 1.30 | 31/08/2018 |
| 95 | Wood Group | 1.70 | 1.79 | 31/12/2017 |
| 96 | Mulalley & Company | 2.20 | 2.32 | 31/03/2019 |
| 97 | Erith | 1.50 | 1.54 | 30/09/2018 |
| 98 | Mount Anvil | 1.07 | 1.10 | 31/12/2017 |
| 99 | Byrne Group | 1.11 | 0.96 | 30/06/2018 |
| 100 | City Building (Glasgow) | 0.97 | 0.97 | 31/03/2018 |
John Morgan agrees that the collapse of what was the UK's second-largest contractor increased scrutiny.
"Carillion was a bit of a wakeup call to people," he says. "If Carillion can go bust, anyone can."
Closer scrutiny of balance sheets is "absolutely right", he adds, as clients and the supply chain need confidence in the health of the companies they contract with.
In recent financial updates to the stock market, Morgan Sindall has gone as far as producing graphs showing average net cash on a daily basis – going back months – to show investors they can be confident in the contractor's financial position.
The cost of boosting the balance sheet
Boosting balance sheets to reassure stakeholders could be coming at the expense of future improvement, however.
Funnelling profit and cash into the balance sheet to cut leverage and boost liquidity means potentially diverting it from other productive investments.

Osborne uses its cash for development activity and its Innovaré offsite construction operation. Mr Steele says getting the investment balance right is challenging.
"It's hard work because you're trying to maintain this balance between a strong balance sheet and the investment," he says.
"That's the hardest bit, there's not a lot of profit to spill back out into massive investment."
"If you're chasing turnover, you've got a bit more latitude if things slip on some of the others"
Andy Steele, Osborne
EY's Mr Marson says many firms consign investment to projects, so the costs can be effectively be covered by the client.
"I haven't come across anyone who's actually running a central R&D programme to improve technology," he says.
"What I have seen is them doing it on specific projects, where they try and fold it into the cost of the project."
Add in the need for many contractors to pay their suppliers faster to avoid falling foul of government requirements and the residual cash to fund innovations dwindles even further.
There is a risk that the swing in focus to balance sheets and liquidity could hold back innovation, which is desperately needed to boost productivity in the sector.
Sharpening up a tougher market
As it stands, heightened financial scrutiny is not going to start diminishing any time soon as there are a number of signals that suggest the industry is entering a tougher environment.
As trading tightens, power swings to those clients who are still in the market, and there are signs they are trying to take advantage of the situation.
Wates's Mr Allen says: "It is a challenging market out there in work-winning terms.
"There is less about, we're starting to see the re-emergence of some of the more traditional, less open and less collaborative procurement routes."
The simple rule for better trading would seem to be to take the less risky jobs, which may mean lower turnover but will also lead to better margins.
"I've talked to two very senior bankers who are on credit committees at banks, and they have said, we are choosing not to go with new clients in the sector"
Ian Marson, EY
Turning down work, even the riskier variety, is not risk-free, however.
"It presents its own problems," Mr Steele says. "It's a different set of problems, because sometimes a couple of the projects that you've been hoping for don't happen."
An order book might be full of these better-quality jobs, but if some of them stall or even get cancelled, then a contractor could find itself struggling to cover fixed overhead costs.
"You can't say, 'we're just going to pick the juicy ones', [in case] suddenly the client pulls the plug," Mr Steele says.
"If you're chasing turnover, you've got a bit more latitude if things slip on some of the others."
With power shifting to clients, DRS Bond Management managing director Chris Davies warns contractors need to be extra vigilant in how they operate now. Contract conditions that Mr Davies describes as "extremely onerous and punitive" are becoming more common.
"A few years ago if you started work under a pre-construction services agreement [PCSA] or letter of intent, you'd be rubbing your hands," he says.
"Now, from a surety perspective, if you're starting on site with a letter of intent or a PCSA, that is a red flag for us. It's a worry because the contract has not been finalised."
At DRS, the team has even seen instances of contractors setting up on site without final contracts signed, only for the client to change the terms once work has started. With so much working capital spent getting on site, firms are accepting different, harsher terms rather than walking away.
Banks get tough
All contractors will have to be wary of more aggressive clients, but many who rely on bank finance will also have to deal with lenders who have fallen out of love with the industry.
"Banks are really nervous about the whole sector," Mr Marson says. "It can't be underestimated how nervous they are.
"I've talked to two very senior bankers who are on credit committees at their banks, and they have said, we are actively choosing not to go with new clients in the sector."
The pool of banks that lend in any serious way to the construction sector is small, according to Mr Marson, at around 10, with six of those bearing most of the lending.

Their experiences with the sector over the past two years have left them wary.
Mr Marson says: "Those banks were very heavily exposed to Carillion, to Interserve, they're probably exposed to Laing O'Rourke and to Kier.
"So they've been in a lot of pain, and all that's come out of it [for them] is they've been asked to take hits against the debt that's owed."
Kier being forced into a £264m rights issue last December and Laing O'Rourke's accounts being delayed while refinancing was finalised show how hard it is for some to renew or obtain fresh credit.
Lenders are determined not to get burned again, so unless contractors can "get more healthy", Mr Marson says, they simply will not want to risk their money.
"The message I know the bankers are delivering to CEOs and CFOs at the moment is, 'get your house in order, show that you can generate the high profit, higher margins you always talk about, and then we'll be more interested in putting more money into the sector'."
It's not just banks directly lending to contractors that has increased the pressure. Banks are also exerting it through customers.
"The banks are effectively telling clients, they won't lend them money unless they're trading with firms the banks are comfortable with," he says.
Price spike danger
Aggressive clients and nervous bankers are problems that contractors can do little to control. But there are signs some are potentially inflicting self-harm in the tougher market.
Mr Davies says: "Even though people know that there's going to be labour and material cost issues, there is some serious under-pricing going on.
"That's been happening for a while, which is always an indicator that folks are starting to scramble for cash."
The pound has weakened against the euro over the past three years, pushing up the cost of imports. If the UK leaves the EU with no deal, then it is expected to slide even further. There is also huge uncertainty about how many migrant workers could be lost as a result.
Arcadis's Mr Rawlinson warns these Brexit-related risks could catch some out.
"I think the industry generally has been fairly unsophisticated around its pricing of Brexit related risk," he says.
"It's something which is not that visible, so you don't see it in most of the cost consultants' inflation forecasts."
He adds: "I think contractors should be wary of being overly exposed to long term contracts post-Brexit."
Mr Marson says firms with high exposure to the London market could be more vulnerable to a spike in input costs because of the heavy use of workers from the EU.
David Allen of Wates sums up how many potentially damaging variables contractors are now facing.
"We contractors all feel that we're facing an increasing level of challenge," he says.
"That's due to the political and economic environment in part. We have greater scrutiny of payment performance, we've got the introduction of the reverse VAT, and we've got a withdrawal of support from banks and the financial sector for many [in the industry].
"So we feel like there's a lot of pressure on us."
In for a rough ride
Anecdotal evidence of a tightening market is backed up by official data.
ONS figures in August showed a 1.3 per cent decline in construction output, while PMI market activity readings have shown a contraction for three months running, the longest period of decline since 2016.
"We don't quite know how it's going to get worse. It might be a millennium bug moment, or it might actually be a real downturn for a long period of time"
Ian Marson, EY
Mr Marson warns the wider economy looks to be in for a rough ride as well.
"I think the general macroeconomic view is that there probably will be a recession at some point in the next year or two," he says.
With uncertainty around Brexit and the future of major schemes such as HS2 and the new Heathrow runway, worrying signs in construction output data and anecdotal evidence of contractors battling with more aggressive clients and wary banks, the picture looks decidedly grim. But the gloominess could be overplayed.
"I think it's easy for everybody to be downbeat because one thinks of Brexit and all that," Mr Morgan says.
However, he believes the market is relatively good right now. "It's not great, but it's good," he says.
Mr Steele echoes this, saying the market has "been tougher" in the past, and some of the most worrying signs are not visible yet.
"I'm not seeing cutthroat margins on projects at the procurement stage [yet]," he says.
Even if we are on the verge of tipping into a much tougher market, or even a recession, there is reason to believe that many firms are already well prepared.
"I think people have taken a lot of pre-emptive pain to get themselves better match fit for it," Mr Marson says.
"A lot of the firms have seen that there is a storm coming and they have been battening down the hatches."
This has included cutting overheads, and this year's CN100 data shows an overall drop in the total headcount, which fell from 255,200 to 254,200. This compares with a 5,000 person increase the year before.
CN100: EMPLOYEES
| CN100 2019 Rank | Company | Employees - Latest | Employees - Previous | Average salary - Latest | Average salary - Previous | Accounting Year Ending |
|---|---|---|---|---|---|---|
| 1 | Balfour Beatty | 19,768 | 20,940 | 56,303 | 56,972 | 31/12/2018 |
| 2 | Kier | 20,064 | 17,940 | 39,668 | 41,488 | 30/06/2018 |
| 3 | Morgan Sindall | 6,660 | 6,409 | 63,514 | 61,944 | 31/12/2018 |
| 4 | Galliford Try | 5,485 | 5,506 | 48,970 | 45,351 | 30/06/2018 |
| 5 | Interserve | 41,423 | 44,711 | 23,637 | 22,932 | 31/12/2018 |
| 6 | Laing ORourke | 12,796 | 15,273 | 52,259 | 50,940 | 31/03/2018 |
| 7 | Mace | 6,376 | 5,042 | - | 63,577 | 31/12/2018 |
| 8 | Amey | 16,476 | 16,981 | 33,172 | 30,023 | 31/12/2018 |
| 9 | ISG | 5,737 | 5,741 | 51,989 | 49,072 | 31/12/2018 |
| 10 | Skanska UK | 2,783 | 2,659 | 52,174 | 54,607 | 31/12/2018 |
| 11 | Wates | 3,897 | 3,972 | 57,418 | 54,224 | 31/12/2018 |
| 12 | Costain | 3,962 | 4,118 | 55,401 | 53,910 | 31/12/2018 |
| 13 | Willmott Dixon | 2,158 | 2,062 | 65,207 | 65,891 | 31/12/2018 |
| 14 | Multiplex | 929 | 1,023 | 82,001 | 76,053 | 31/12/2018 |
| 15 | VolkerWessels UK | 2,925 | 2,733 | 52,728 | 50,064 | 31/12/2018 |
| 16 | Bam Construct | 2,241 | 2,297 | 50,915 | 48,672 | 31/12/2018 |
| 17 | Bouygues UK | 4,106 | 3,733 | 39,359 | 38,600 | Various |
| 18 | Bowmer and Kirkland | 1,489 | 1,319 | 53,964 | 53,458 | 31/08/2018 |
| 19 | Vinci | 3,450 | 3,482 | 38,374 | 36,836 | 31/12/2018 |
| 20 | Sir Robert McAlpine | 2,182 | 2,209 | 63,392 | 59,781 | 31/10/2018 |
| 21 | Murphy Group | - | 3,878 | - | 70,393 | 31/12/2018 |
| 22 | Morrison Utility Services | 4,234 | 3,970 | 37,908 | 34,761 | 31/03/2018 |
| 23 | Engie Regeneration | 2,454 | 2,239 | 38,017 | 38,412 | 31/12/2018 |
| 24 | Bam Nuttall | 2,904 | 2,843 | 50,783 | 47,967 | 31/12/2018 |
| 25 | Graham | 2,161 | 2,108 | 42,356 | 40,287 | 31/03/2019 |
| 26 | Robertson | 2,640 | 2,295 | 35,765 | 37,519 | 31/03/2019 |
| 27 | McLaren | 691 | 648 | 66,562 | 68,525 | 31/07/2018 |
| 28 | Lendlease | 704 | 680 | 72,827 | 72,529 | Various |
| 29 | NG Bailey | 3,224 | 2,764 | 44,386 | 42,945 | 01/03/2019 |
| 30 | Renew | 2,675 | 2,713 | 46,740 | 44,494 | 30/09/2018 |
| 31 | Colas | 2,584 | 2,381 | 49,900 | 50,937 | Various |
| 32 | Carey Group | 1,325 | 1,463 | 52,491 | 47,431 | 31/03/2018 |
| 33 | Buckingham Group | 534 | 477 | 54,468 | 54,682 | 31/12/2018 |
| 34 | Hill Holdings | 503 | 432 | 66,163 | 58,060 | 31/12/2018 |
| 35 | Eurovia Group | 2,694 | 2,636 | 36,711 | 33,976 | 31/12/2018 |
| 36 | Winvic | 204 | 178 | 69,019 | 76,299 | 31/01/2018 |
| 37 | McLaughlin & Harvey | 777 | 790 | 50,089 | 47,291 | 31/12/2018 |
| 38 | Keltbray | 1,557 | 1,393 | 54,328 | 55,738 | 31/10/2018 |
| 39 | McAleer & Rushe | 332 | 300 | 61,184 | 55,166 | 31/12/2018 |
| 40 | Imtech | 2,198 | 2,170 | 56,689 | 47,394 | 31/12/2018 |
| 41 | JRL Group | 871 | 706 | 44,275 | 41,262 | 31/12/2017 |
| 42 | Northstone (NI) | 1,388 | 1,247 | 34,967 | 35,047 | 31/12/2018 |
| 43 | Watkin Jones | 731 | 680 | 28,394 | 29,779 | 30/09/2018 |
| 44 | NMCN | 1,536 | 1,422 | 44,777 | 43,248 | 31/12/2018 |
| 45 | Higgins Group | 379 | 422 | 75,828 | 82,768 | 31/07/2018 |
| 46 | T Clarke | 1,346 | 1,348 | 51,263 | 45,030 | 31/12/2018 |
| 47 | John Sisk & Son | 465 | 391 | 63,886 | 60,639 | 31/12/2018 |
| 48 | Osborne | - | - | 48,848 | 45,674 | 31/03/2018 |
| 49 | SSE Contracting | 0 | 0 | - | - | 31/03/2018 |
| 50 | FM Conway | 1,546 | 1,469 | 43,331 | 42,988 | 31/03/2019 |
| 51 | JN Bentley | 1,487 | 1,218 | 40,902 | 40,374 | 31/12/2018 |
| 52 | OHOB | 113 | 111 | 102,558 | 98,978 | 31/03/2019 |
| 53 | Ferrovial Agroman UK | 456 | 455 | 73,886 | 77,879 | 31/12/2018 |
| 54 | Severfield | 1,274 | 1,354 | 43,947 | 45,266 | 21/03/2019 |
| 55 | MV Kelly | 128 | 112 | 94,148 | 79,584 | 31/05/2018 |
| 56 | Clancy | 2,314 | 2,430 | 41,231 | 37,135 | 31/03/2018 |
| 57 | Forth Holdings | 2,154 | 1,927 | 33,215 | 31,370 | 31/08/2018 |
| 58 | Midas Group | 537 | 482 | 48,182 | 49,226 | 30/04/2019 |
| 59 | Ardmore | 315 | 353 | 65,604 | 56,966 | 30/09/2018 |
| 60 | RG Carter | 1,076 | 1,116 | 36,621 | 34,711 | 31/12/2017 |
| 61 | United Living Group | 520 | 506 | 51,504 | 47,328 | 31/03/2018 |
| 62 | Ogilvie | 634 | 551 | 34,188 | 33,191 | 30/06/2018 |
| 63 | Spie | 3,257 | 3,615 | 26,765 | 30,390 | 31/12/2018 |
| 64 | Rydon Group | 702 | 750 | 46,308 | 43,668 | 30/09/2018 |
| 65 | Briggs & Forrester | 780 | 769 | 54,443 | 49,951 | 31/10/2018 |
| 66 | Bechtel | 702 | 743 | 88,887 | 94,777 | 31/12/2018 |
| 67 | Caddick Group | 448 | 406 | 42,036 | 37,502 | 31/08/2018 |
| 68 | William Hare | 1,697 | 1,761 | 26,991 | 25,796 | 31/12/2017 |
| 69 | Esh | 1,038 | 1,097 | 35,081 | 34,398 | 31/12/2017 |
| 70 | RGCM | 142 | 143 | 57,265 | 59,381 | 31/12/2017 |
| 71 | Permasteelisa | 103 | 100 | 61,716 | 61,650 | 31/03/2018 |
| 72 | Cruden Holdings | 636 | 624 | 39,549 | 37,127 | 31/03/2018 |
| 73 | SDC | 376 | 369 | 48,743 | 47,890 | 30/09/2018 |
| 74 | Barhale | 844 | 710 | 48,316 | 42,194 | 30/06/2018 |
| 75 | Alun Griffiths | 704 | 594 | 37,587 | 35,819 | 31/12/2017 |
| 76 | Actavo | 2,426 | 2,258 | 33,528 | 35,115 | 31/12/2017 |
| 77 | Gilbert Ash | 177 | 174 | 51,020 | 44,839 | 31/12/2018 |
| 78 | Clugston | 629 | 579 | 38,582 | 38,851 | 31/01/2018 |
| 79 | Seddon | 687 | 698 | 41,543 | 41,362 | 31/12/2018 |
| 80 | Cape Industrial Services | 3,179 | 3,174 | 51,082 | 46,144 | 31/08/2018 |
| 81 | Babcock Rail | 1,052 | 1,113 | 50,471 | 50,452 | 31/03/2018 |
| 82 | Michael J Lonsdale | 139 | 133 | 70,935 | 62,985 | 30/09/2018 |
| 83 | Morrisroe Group | 205 | 208 | 49,827 | 46,777 | 31/10/2018 |
| 84 | Durkan Holdings | 182 | 175 | 70,106 | 64,065 | 30/11/2018 |
| 85 | Lindum | 660 | 629 | 34,333 | 35,065 | 30/11/2018 |
| 86 | Eric Wright Group | 644 | 625 | 41,696 | 37,910 | 31/12/2017 |
| 87 | Novus | 920 | 862 | 33,541 | 32,150 | 31/12/2018 |
| 88 | One Group Construction | 558 | 542 | 38,051 | 37,125 | 31/12/2018 |
| 89 | Stepnell | 436 | 422 | 45,176 | 44,773 | 31/03/2018 |
| 90 | Dodd Group | 824 | 773 | 35,466 | 38,542 | 31/03/2018 |
| 91 | HG Construction | 75 | 71 | 73,960 | 67,380 | 31/12/2018 |
| 92 | Gratte Brothers | 470 | 469 | 51,317 | 48,777 | 31/03/2018 |
| 93 | E W Beard | 316 | 305 | 55,497 | 56,007 | 31/12/2018 |
| 94 | Masterson Holdings | 285 | 268 | 64,276 | 72,933 | 31/08/2018 |
| 95 | Wood Group | 2,001 | 2,048 | 38,456 | 35,192 | 31/12/2017 |
| 96 | Mulalley & Company | 529 | 507 | 49,790 | 50,645 | 31/03/2019 |
| 97 | Erith | 626 | 582 | 47,703 | 44,758 | 30/09/2018 |
| 98 | Mount Anvil | 205 | 184 | 85,644 | 85,962 | 31/12/2017 |
| 99 | Byrne Group | 432 | 762 | 69,042 | 55,587 | 30/06/2018 |
| 100 | City Building (Glasgow) | 1,806 | 2,231 | 28,770 | 28,096 | 31/03/2018 |
Mr Marson says: "A lot of contractors have been through or they are nearing the completion of overhead reduction programmes."
"They have generally cut aggressively, and assumed their businesses will be smaller when they've been cutting into their overhead."
If demand slides further in the near future, more firms should be better placed to absorb the loss of revenue.
Just in time
It is hard to get away from the view that the market is likely to get tougher in the short term.
As Mr Marson puts it: "We don't quite know how it's going to get worse. It might be a millennium bug moment, or it might actually be a real downturn for a long period of time."
If contractors are going to weather any storm and come out the other side there are some key principles they must hold on to.
"Big is no longer beautiful. Big doesn't necessarily mean stable anymore"
Andy Steele, Osborne
"The wisest thing now that contractors can be doing is not focusing on turnover, it is purely focusing on margin and most of all, focusing on cash," Mr Davies says.
It provides some comfort that overall, this year's CN100 shows many firms are doing just that. Size is not the prime ambition it once was for many, especially since Carillion's collapse.
"Big is no longer beautiful," Mr Steele says: "Big doesn't necessarily mean stable anymore."
There is almost a compulsion in business to be constantly growing. It can, after all, provide great benefits such as bigger market share, which opens up new opportunities, and it keeps staff motivated with new challenges.
But when conditions change and demand starts to dry up, continued growth can pave the way to disaster.
Carillion's collapse made pulling back from growth and focusing on margins not just more acceptable but desirable, especially among the largest firms. And the extra scrutiny of balance sheets has forced some to face up to deep seated problems linked to debt, while others reconsider just how resilient their finances are.
In a strange way, the demise of Carillion could yet prove to be of benefit to the wider industry.
Its collapse dispelled some dangerous myths and might well have forced the industry to shape up and become more resilient, just in time to face a potentially much more challenging environment.
Source: https://www.constructionnews.co.uk/financial/cn100-2019-top-100-uk-contractors-05-09-2019/
Posted by: duceysheldonnoe.blogspot.com
